
Technical and Evidence-Based Foundation
60M+
Number of medical records
2,000+
Metabolic Markers / Session
10yr+
Practical Model Operation
6
Health Risk Model

Silicon Valley Technology DNA
🏛️
3 Top Institutions
🌉
Silicon Valley · San Francisco Bay Area
🔬
Clinical + Academic + Industry

San Francisco Bay Area · Silicon Valley
A world-class center for technological and biomedical innovation


Partnership Declaration
01 · Data Sources and Baseline Construction
60M+
Medical and Population Database
Over 60 million medical records, including electronic health records, laboratory data, diagnosis codes, and long-term follow-up records, are used to train and evaluate health risk models.
Metabolomic Baseline
Full metabolic profiling of tens of thousands of Asian adults
Used as a population reference panel for biological age and health risk scores, to calculate relative risk percentiles and age differences.
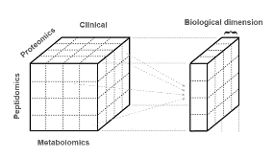
Multi-omics data dimensions
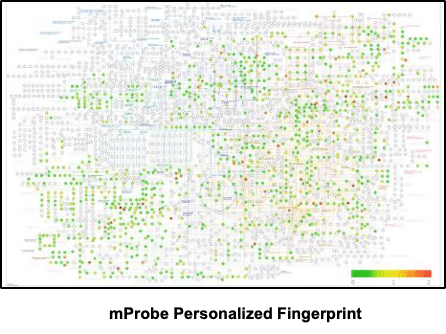
mProbe Personalized Fingerprint
01.2 · Full-Spectrum Metabolomics Data
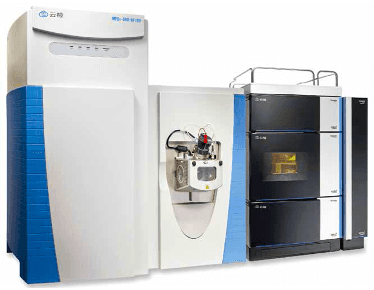
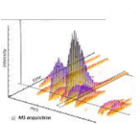
MS Acquisition — 3D Signal Profile
Longitudinal Signal Stability · Time Series

Metabolite Categories Covered
01
central carbon metabolism
Glycolysis, TCA Cycle, Pentose Phosphate Pathway
02
Amino acid metabolism
Glycine/Serine/Threonine, Branched-Chain Amino Acids
03
Lipid metabolism
Fatty acids, phospholipids, and acylcarnitines
04
Oxidative Stress & Inflammation
Metabolites such as methylglyoxal and lactic acid
Laboratory Accreditation
CAP Certified / CAP Certified
CLIA Certified
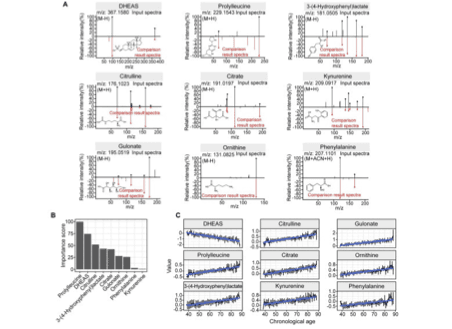
02 · Biological Age Model and Aging Rate
1
Inner Age
Predicted Biological Age — the age corresponding to metabolic features
2
Age Gap ΔAge
ΔAge = Biological Age − Chronological Age, a positive value indicates accelerated aging
3
Aging Rate Indicator
Estimates the rate of change over time based on longitudinal data, reflecting the dynamic trajectory of aging
Report Presentation Strategy
Communicate externally using a "percentile rank" and "age difference" approach to avoid misinterpreting the estimated age as a diagnostic result. The model has been running continuously for over 10 years and has accumulated a large amount of real-world application data.
Model Architecture Diagram
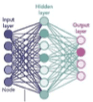
Multi-layer neural network architecture: taking 2,000+ metabolic features as input, extracting features through hidden layers, and outputting a predicted biological age.
Model Output Example
Chronological Age
45
Inner Age
38
ΔAge
-7
Aging Rate Index
0.84×
Percentile rank: Top 12% (slower-aging group)
03 · Health Risk Model
Process Overview (Simplified Description)
🔍
Feature Extraction
⚙️
Feature engineering
🤖
Model Training and Validation
📊
Risk Score Output
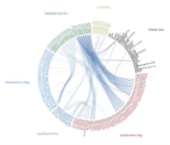
Metabolic Pathways — Disease Association Map
Sankey diagram showing the cross-relationships between metabolic pathways and multiple diseases
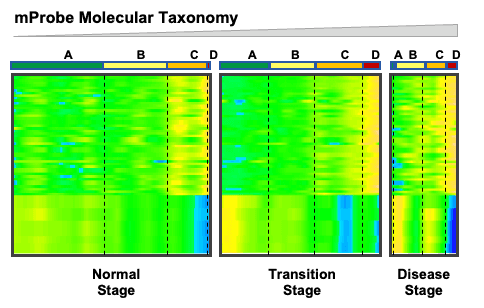
mProbe Molecular Taxonomy
Normal → Transitional → Disease Stage Metabolome Cluster Heatmap
Current Coverage: 6 Major Health Conditions
Each disease has its own model, training data, and validation results.
04 · In-Depth Case Analysis: Type 2 Diabetes
From metabolic pathways to
Specific metabolites
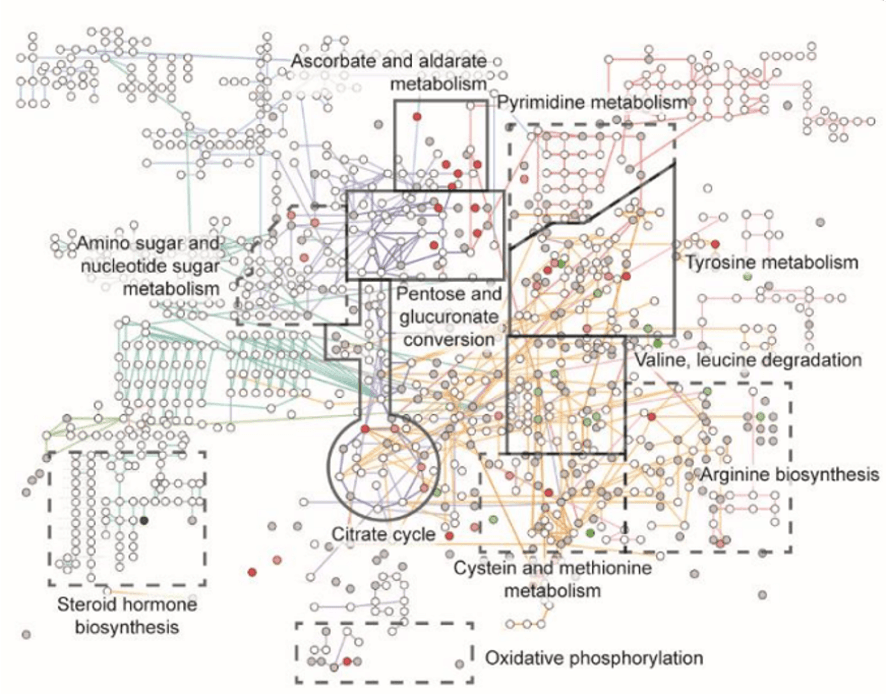
Related Metabolic Pathways (Excerpt)
1
Amino sugar and nucleotide sugar metabolism
2
Glycolysis / Gluconeogenesis
3
HIF-1 signaling pathway
4
Pentose phosphate pathway
5
Glycine, serine and threonine metabolism
6
Propanoate metabolism
The aforementioned pathways exhibit high biological relevance to glucose metabolism, insulin sensitivity, oxidative stress, and microvascular complications.
Using pyruvate as an example: Practical recommendations
✓
Avoid high-glycemic-index foods to reduce the metabolic burden on glucose metabolism.
✓
Increase aerobic exercise to improve mitochondrial function and glucose metabolism efficiency.
✓
Supplementing specific B vitamins helps promote the flow of glycolytic products into the TCA cycle.
All recommendations are supported by biological mechanisms and scientific literature, with full citations included in the report.
Key Metabolites and Directionality
Percentage variance in concentration compared to general population baseline.
Pyruvate
+1%
Positive correlation
During the glucose tolerance test, the rise in levels is delayed and remains elevated, reflecting decreased pancreatic islet function.
Lactate
+25%
Positive correlation
Abnormal glucose metabolism is strongly associated with insulin resistance.
Methylglyoxal
+18%
Positive correlation
Glycation stress marker, accelerating microvascular damage
beta-D-Glucose
+12%
Positive correlation
Directly reflects the extent of blood glucose metabolism imbalance.
Supporting Evidence

05 · References and Academic Foundation
1
2
3
4
📄
Request the technical white paper and full references